Solar Thermal Heating Project
Here is an interesting experimental project involving WebIO v3 and its use of wireless temperature sensors
and control automation.
To supplement home heating a solar thermal panel is used as a solar air heat collector,
providing heated air that is fan forced into one room of a house and hopefully offsetting
a portion of heating energy cost.
In this case we built our own solar thermal panel referring to many designs found on the Internet.
|
|
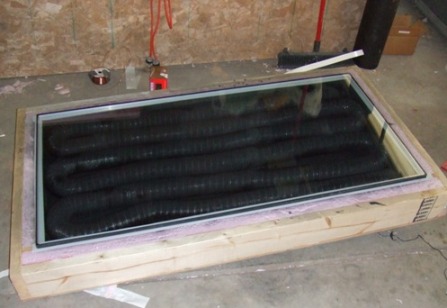
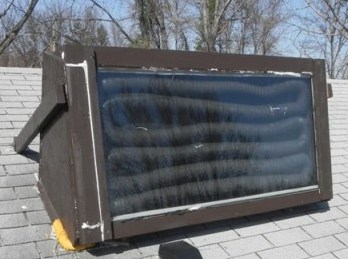
Solar thermal panel construction
|
The panel is framed with 2x6 boards, a plywood back and a large double pain of glass.
The interior is lined with 2" foam and 1" board.
Inside is flexible 3" aluminum air ducting that is painted black using high temperature flat black spray paint.
The air ducting is used so that there is a separation from the heat in the solar panel and the air that
flows from and into the house. This acts a barrier from the smell caused by the high temperature in the panel.
It is also important to not rigidly fasten the glass to the panel, we used a layer of 1/4 inch foam around
the glass but it still cracked, possibly due to flexing of the wood frame or heat.
In the summer time we added exterior air vents and a white vinyl cover to keep the panel from overheating.
|
|
| Solar Thermal - Installation |
|
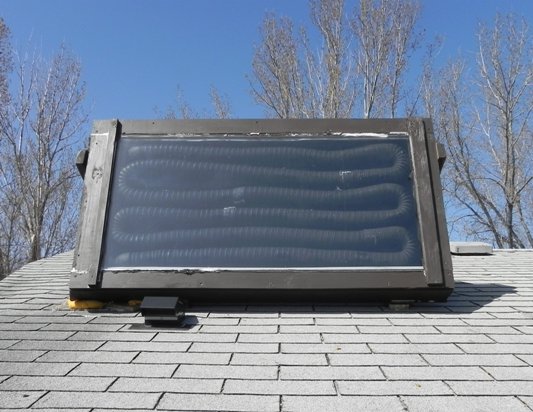
Solar Panel Installation
The solar thermal panel was mounted on the roof, probably not the best place for it
due to air ducting has to then pass all the way through the attic, a long way down to
force hot air.
It is probably a better idea to place solar thermal on the south side
wall of a house, but the south side of this house is almost all windows anyways.
|
|
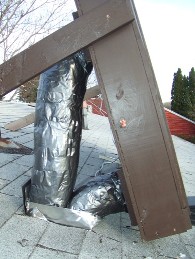
Solar thermal panel construction
|
Note the insulated air ducting: The bottom air duct is the cold air intake
coming from a basement storage room. This air duct is connected to a bathroom style ceiling
fan (120cfm rated) that pushes air into a 4" air duct. This ceiling fan is turned on by WebIO when the
wireless temperature in the solar panel rises about 80 degrees Fahrenheit.
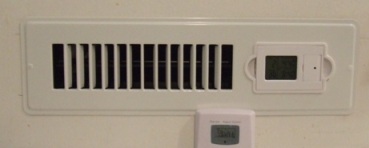
The top air duct is the hot air output which is
delivered to the kitchen where an electronic controlled vent cover was installed in the wall.
This vent allows WebIO to open and close the vent so as not to allow cold air to circulate
when the panel is not hot.
|
|
|
|
|
| WebIO Solar Thermal Heating Control |
|
WebIO Solar Thermal Automation
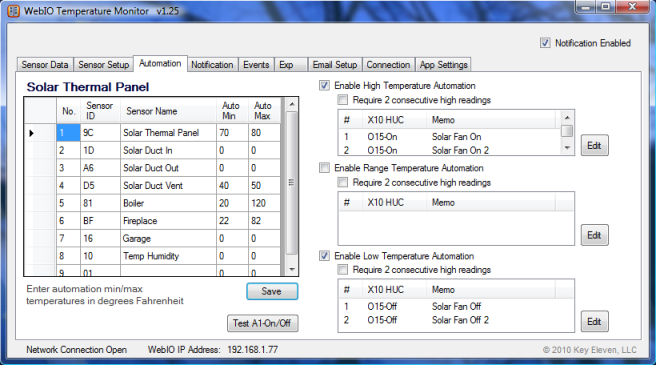
WebIO-TM PC Software for Temperature Control Automation
WebIO is used to automate the solar thermal air circulation fan and open/close the air duct vent.
The solar panel has an Oregon Scientific wireless temperature sensor with wired probe (Model THC268).
The wireless temperature transmitter unit is installed in the attic of the house so that
the batteries can be changed every year,
a wire feeds from the wireless transmitter to a probe inside the solar panel.
WebIO-TM software is then setup with an automation on the sensor to turn on the air duct fan
when the temperature in the panel is above 80 degrees Fahrenheit and turn off at 70 degrees Fahrenheit.
To turn on/off the fan, the fan is plugged into an X10 powerline appliance module controlled by WebIO.
Instead of X10 the WebIO Expansion Port Relay board could have been used, but it was easier to use
WebIO's ability to communicate over AC powerlines to control an X10 appliance module which turns
on or off any AC powered device that is under 1500 watt.
The ceiling ventilation fan draws 60 watts and is rated to move 120cfm of air.
It is important to move enough air so that the solar panel does not get too hot and to efficiently
move heat from the panel into the house.
In the WebIO-TM screenshot above, note the automation settings for the solar thermal panel, set points
of 80 and 70 and the high and low automations to turn on/off an X10 Module.
To automate opening and closing the air duct vent, we purchased a vent that can open/close a damper on a timer,
but because we want to open/close based on solar panel temperature, we re-wired it to a relay on the
WebIO expansion port relay board (plus some electronics to limit the time the vent damper motor operates to 2 seconds).
|
|
| Solar Thermal Temperature Graphing |
|
WebIO-TM Temperature Graphing
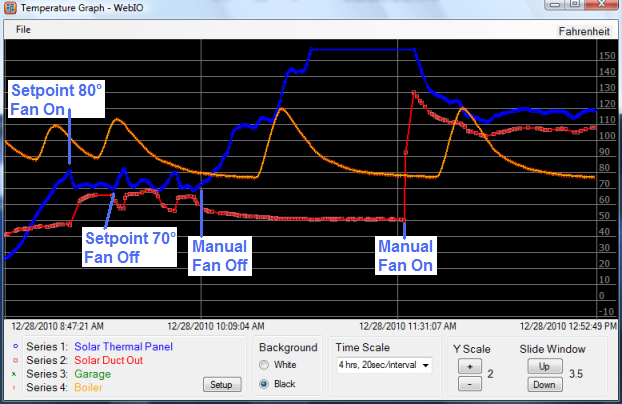
WebIO-TM Real-Time Temperature Graphing
The WebIO-TM graph above displays three data series: Solar thermal panel temperature in Blue,
solar air duct temperature (temperature of air flow into kitchen) in Red,
and the house heating hot water boiler in Orange. The outside temperature was about 10 degrees Fahrenheit.
In the graph screen above, note the temperature oscillations from 70 to 80 degrees
in the morning hours due to the temperature automation of the air duct fan (much like a thermostat).
At 10:00 AM the fan was turned off allowing the solar panel to rapidly heat up,
note that the wireless sensor used has a limit about 154 Degrees F.
Later the fan was turned back on, moving heat from the solar panel to the kitchen air vent.
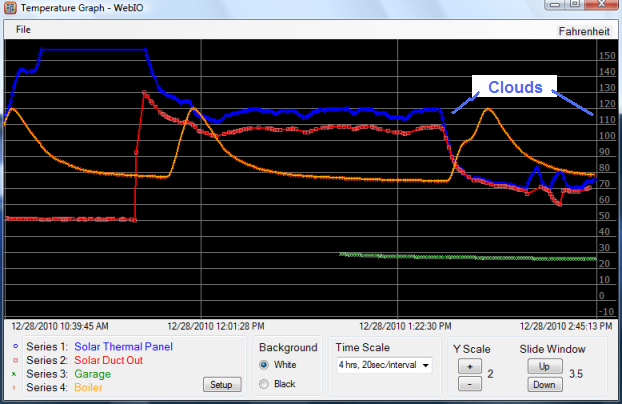
WebIO-TM Real-Time Temperature Graphing Example #2
In this second graphing example note the solar panel temperature of nearly 120 degrees F
and the kitchen air vent temperature of 110 degrees F, a 10 degree loss in the transfer of heat.
Also note what happened when cloud cover interfered later in the day.
|
|
| Solar Thermal Temperature Data |
|
WebIO-TM Temperature Data Export
The WebIO-TM software logs all temperature readings received by WebIO over the TCP/IP network.
This data is logged as just a series of temperature events.
The WebIO-TM Graphing Screen logs the temperature data series in a row-column format that
is better for import into spreadsheet software such as Microsoft Excel, OpenOffice or Lotus 123.
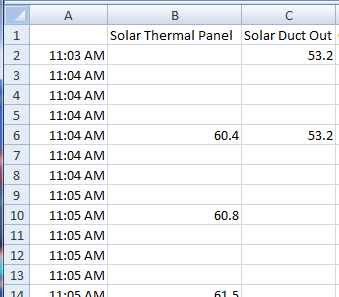
The screenshot to the right displays a segment of data imported into Excel.
I found it best to convert spreadsheet cells containing the logged date-time stamps into just time
when used to create a graph in Excel.
Also note how the data is recorded in intervals such that not every interval contains a sensor reading
for every sensor. In an Excel graph, you can right click the graph and select an option screen that
provides the option to connect data points with lines due to not having data on each interval.
|
|
Graph data import into spreadsheet
|
Spreadsheet Data Graphing
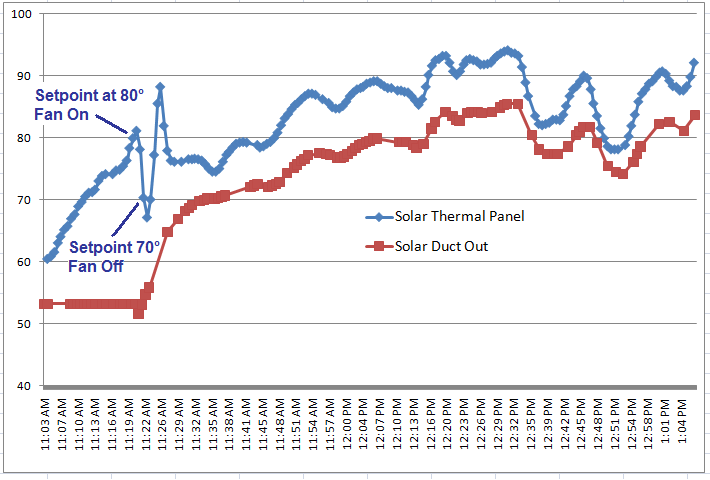
Excel spreadsheet graph of WebIO-TM temperature data
The above graph was created with Excel, showing the data from a WebIO-TM Graph data export.
|
|
|
|
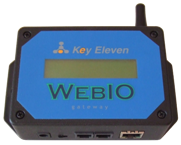
WebIO v3 - Wireless Temperature and X10
Powerline Control

|
|
The solar thermal panel at time of writing this document is now in its second winter,
I dont expect the panel to last many more years as the heat and weather really take a toll
on it.
It would really be interesting to know how much heat energy is being generated and provided
to assist in heating the house.
It would be very interesting to know the accumulated BTU output per day.
For more info on WebIO v3 see:
http://www.webio.us/version3/index.html
|
|